
What I Check Before Trusting E-commerce Analytics
Every optimisation decision inherits the quality of the data behind it. That sounds like a truism until you watch a team spend six weeks redesigning a page because of an event that was firing twice.
On this page
I do not audit analytics because I enjoy it. I do it because the alternative is acting on numbers whose provenance nobody can explain, and because the errors are rarely random. Broken tracking tends to fail in one direction, which means the conclusions drawn from it fail in one direction too.
Start by reconciling with the backend
Before looking at any report, I compare order count and revenue in analytics against the store’s own order records for the same period. Same timezone, same definition of a completed order.
If those two numbers are within a couple of percent, the tracking is probably sound enough to reason with. If analytics reports fifteen percent more orders than the store, something is duplicating. If it reports thirty percent fewer, something is being dropped.
This single check answers more than most audits, and it takes ten minutes. It is also the check people skip, because it risks invalidating a dashboard the team has been using for a year.
Refunds and cancellations belong in this comparison. Analytics usually counts the order at purchase and never hears about the refund, so a store with high return rates will show revenue that its accounting does not recognise.
Duplicate and missing events
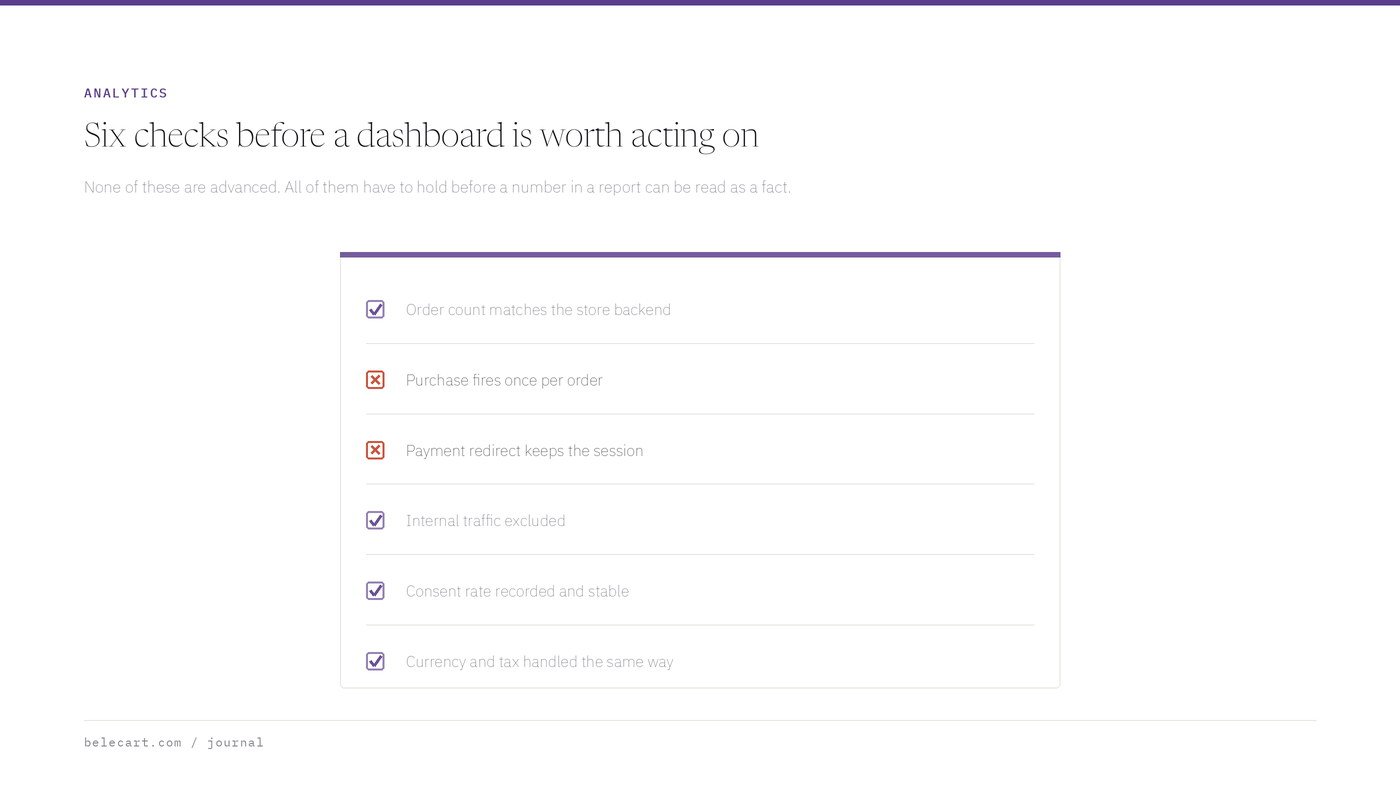
Duplicate purchase events are the most common serious fault I find. The usual causes are the same tag installed both in the platform’s native integration and in a tag manager, or a confirmation page that fires on reload.
The symptom is a conversion count that looks good and a conversion rate that looks impossible. If your reported conversion rate is well above what the category normally sustains, suspect the counter before celebrating.
Missing events are quieter. An add-to-cart that only fires on one of two buttons, a variant selector that replaces the DOM node the listener was bound to, a mobile template that never loaded the script at all. The funnel report then shows a collapse between two steps that customers are actually passing through fine.
I test this by hand: perform the action on desktop and mobile, on the two or three product templates the store uses, and watch what arrives in real time. Reading the tag configuration is not the same as watching the event.
Checkout events and payment redirects
Checkout is where measurement gets structurally hard, because the customer often leaves the site in the middle of it.
A redirect to a payment provider and back can start a new session. When it does, the purchase gets attributed to a referral from the payment provider rather than to whatever brought the customer in. Stores that take a lot of bank transfers or wallet payments can find a surprising share of revenue credited to their processor.
The fix is to add the payment domains to the referral exclusion list, and then verify it worked rather than assuming. I check by looking for the processor’s domain in the source report at all.
Order confirmation pages that are reachable from email or order history create the same duplication problem as reloads. If a customer can revisit that URL a week later, the purchase event can fire again.
Consent changes what you can see
Where consent is required before tracking, a portion of visitors will never be measured. That portion is not random. It skews by geography, by device, and by how the banner is designed.
This matters in two ways. Absolute counts understate reality, so comparing a European market against one without consent requirements will show a difference that is partly measurement. And behaviour differs between people who accept and people who decline, so the measured group is not a clean sample of the whole.
I want to know the consent rate before interpreting anything, and I want to know whether it changed during the period being analysed. A banner redesign can move a conversion rate several points without a single thing changing on the site.
Modelled or estimated conversions fill some of this gap. They are estimates. They are reasonable for trend, weak for reconciliation, and should never be reported next to backend revenue as though the two were the same kind of number.
Attribution disagreements
Attribution is a modelling choice, not a measurement. Last click, first click, position based and data driven will each hand the same order to a different channel, and all of them are defensible.
The practical consequence is that a channel’s value depends on the model chosen, and the model was usually chosen by default rather than deliberately. Teams then compare a channel’s performance across tools that use different defaults and conclude one tool is wrong.
My preference is to pick one model, keep it, and be explicit that it is a lens. Then use incrementality tests for decisions that actually matter, such as whether a channel is generating demand or capturing demand that already existed. Turning a channel off for a defined period in a defined region answers that better than any attribution report.
Why ad platforms do not match each other
Each platform reports conversions it believes it caused, using its own window and its own view-through rules. Two platforms can both legitimately claim the same order.
Sum the platform-reported conversions for a store spending across three networks and the total will usually exceed real orders. Nobody is lying. The definitions overlap.
What I do with this: treat platform numbers as internally valid for comparing campaigns inside that platform, and never as a source for totals. Totals come from the store. Then track the ratio between platform-claimed and backend-tagged orders per channel over time. A stable ratio means the platform is a usable steering signal even if it is inflated. A ratio that swings around means something changed in tracking, not in performance.
Server-side tracking does not fix definitions
Moving collection server-side solves a real set of problems. It survives ad blockers and browser restrictions on third-party storage, and it gives you control over what leaves your infrastructure.
It does not fix a purchase event that fires on the wrong page, a currency field sending gross where the report expects net, or a team that has never agreed what counts as a new customer. Those are definition problems, and they travel intact through any transport layer.
I have watched a migration to server-side collection get credited with a jump in reported conversions when the jump was recovered ad-blocked traffic. Real improvement, wrong explanation, and the wrong lesson learned about which channels were working.
Before any migration I want the current numbers reconciled and documented, so afterwards there is something to compare against. Otherwise the change becomes untestable, and every later discrepancy gets blamed on it.
Write the measurement plan down
The most useful artefact in an analytics setup is a plain document listing each event, when it fires, what parameters it carries, and which question it exists to answer.
Events without a question behind them are the reason properties accumulate two hundred custom dimensions that nobody queries. Every one of those still has to be maintained, and each adds a way for the setup to break.
The document also settles arguments. When two people disagree about what conversion rate means, the answer should be findable in thirty seconds rather than reconstructed from tag configuration.
The order I work in
- Reconcile analytics orders and revenue against backend records for the same window.
- Check for duplicate purchase events by comparing transaction identifiers, and confirm the confirmation page cannot fire twice.
- Walk the full purchase path on mobile and desktop while watching events arrive.
- Confirm payment and wallet domains are excluded as referrers, then verify in the source report.
- Find the consent rate and check whether the banner changed during the period.
- Note which attribution model each report uses before comparing any two of them.
- Check timezone and currency settings, which quietly break week-over-week comparisons.
- Write down what the data cannot answer, so nobody builds a decision on a gap.
The last step is the one I would keep if I could only keep one. Most analytics disasters are not wrong numbers. They are correct numbers answering a question nobody asked, used to settle a question they cannot address.